
Week 24/31: DevOps and DataOps Practices for Data Engineering Interviews
Building trustworthy, observable, and resilient data systems with the right mindset, culture, and tools.

DevOps is more than just a set of tools like Docker, it's a mindset and a way of working. It emphasises collaboration, shared responsibility, and a strong team culture. As highlighted in Effective DevOps: Building a Culture of Collaboration, Affinity, and Tooling at Scale1 by by Jennifer Davis and Ryn Daniels, the true power of DevOps comes from how people and tools work together to enable safe, fast, and reliable change.
DevOps is a way of working where developers and operations teams work together instead of separately. In the past, developers would build software, then hand it off to the IT team to run, often causing delays and problems. DevOps fixes this by making them one team, using tools like automation and version control to release software quickly and safely.
DataOps takes the ideas of DevOps and applies them to data work. In data engineering, we're not just writing code; we’re moving and transforming data from many sources. DataOps helps teams plan, build, test, and release data products in a fast and reliable way.
In data engineering, especially where it overlaps with software development, applying DataOps principles is a game-changer. It not only prevents costly errors and improves reliability, but also shows we’re thinking beyond just building pipelines; we’re thinking about building trustworthy, maintainable systems.
In this post, we’ll cover:
What is DataOps?
Three pillars of DataOps
How DataOps fits into the Data Engineering Lifecycle.
Key DevOps/DataOps tools every Data Engineer should know.
interview questions, including hands-on scenarios involving Docker, CI/CD, and Terraform
Don’t miss our Data Engineering Interview Preparation series, check out the full posts [here2] and subscribe to stay updated with new posts and tips.
Here is the full plan:
What is DataOps?
Problems are inevitable, whether a server crash, a cloud outage, buggy code, or bad data. How we manage data, from collection to action, matters more than ever.
DataOps is the discipline of applying DevOps, Agile, and Lean principles to data workflows. It focuses on delivering high-quality, trustworthy data products, like dashboards, machine learning models, and reports, faster and more reliably.
While software delivers features, data delivers insight. That makes collaboration, testing, monitoring, and continuous delivery just as critical in data engineering.
Core ideas behind DataOps:
1. Culture over tools
While automation and monitoring tools are essential, DataOps is fundamentally about breaking down silos between data engineers, analysts, scientists, and business stakeholders. It's about creating a culture of collaboration, shared responsibility, and continuous learning.
2. Data products, not just data
Raw data has no value until it becomes actionable insights. DataOps focuses on delivering complete data products: dashboards, ML models, reports, that solve real business problems and provide measurable value.
3. Continuous Everything
Just as DevOps emphasises continuous integration and deployment, DataOps champions continuous data quality, continuous monitoring, and continuous improvement of data workflows.
Three Pillars of DataOps
In the book Fundamentals of Data Engineering3 by Joe Reis and Matt Housley, three technical elements are defined for dataops:
Automation
Automation in DataOps goes beyond simple task scheduling. It covers the entire data lifecycle, from ingestion to deployment.
Key Components:
Version Control for Everything: Not just code, but data schemas, configurations, and even sample datasets.
CI/CD for Data Pipelines: Automated testing, staging environments, and controlled deployments.
Infrastructure as Code: Reproducible environments and consistent configurations.
Automated Data Quality Checks: Built-in validation that runs with every data transformation.
Monitoring & Observability
Data problems often hide in plain sight. A pipeline might be running successfully while producing completely wrong results. Comprehensive observability makes the invisible visible.
What to Monitor:
a. System Health:
Pipeline execution times and success rates.
Resource utilisation and performance metrics.
Data volume trends and anomalies.
b. Data Quality:
Schema evolution and breaking changes.
Data freshness and completeness.
Statistical distributions and data drift.
Business rule violations.
c. Business Impact:
SLA compliance for data products.
End-user engagement with dashboards and reports.
Model performance degradation.
Incident Response
Even the best data systems will experience issues. The difference between mature and immature data teams isn't the absence of problems; it's how quickly and effectively they respond.
Components of Effective Incident Response:
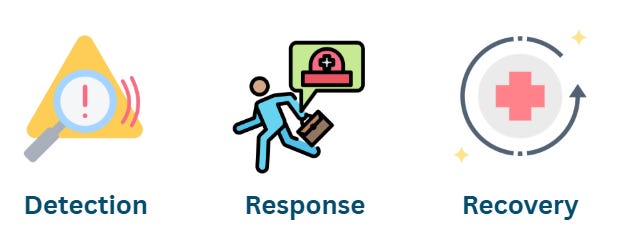
Detection:
Real-time alerting with clear severity levels.
Automated escalation procedures.
Business impact assessment.
Response:
Clear runbooks and playbooks.
Defined roles and responsibilities.
Communication protocols for stakeholders.
Recovery:
Automated rollback capabilities.
Data backfill and reconciliation procedures.
Post-incident analysis and learning.
Best Practices:
After a problem, we look at how to improve the system, not who to blame.
Practice how to handle incidents before they happen.
Documentation of lessons learned and preventive measures.
Integration with business continuity planning.
DataOps Across the Data Engineering Lifecycle
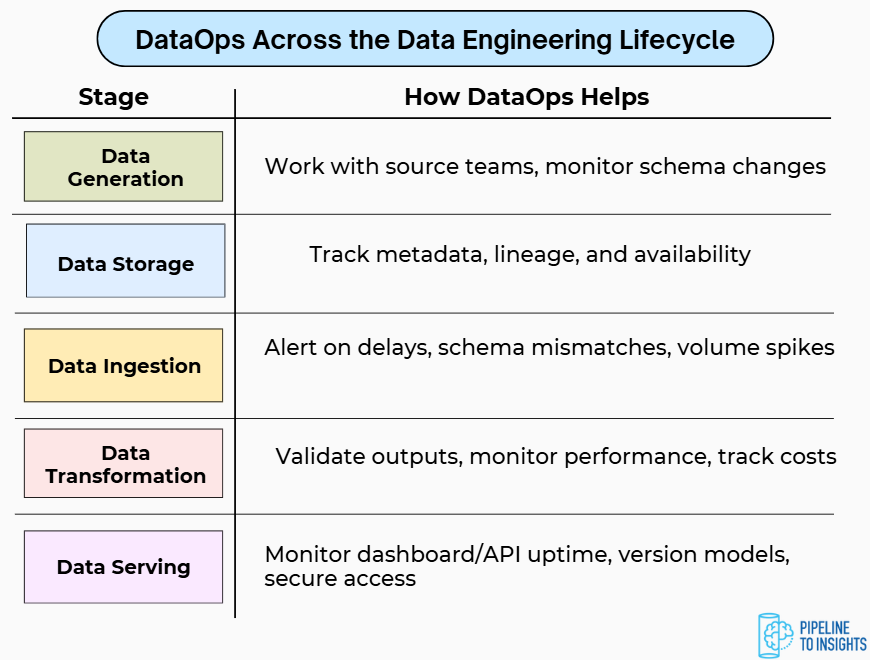
DataOps isn’t isolated; it supports every stage of the data Engineering lifecycle.
Data Generation
Often overlooked, this phase is where everything begins.
Collaborate with source system teams: Changes in app databases can break your pipelines.
Automate independently: Decouple workflows to reduce the blast radius of failures.
Monitor source system availability and schema consistency.
Data Storage
Storing data isn’t just about disk space, it’s about trust.
Monitor both system health (availability, performance) and data quality (schema, freshness, and so on).
Track metadata and lineage to improve discoverability and governance.
Data Ingestion
The most fragile and critical layer.
Monitor ingestion delays, data volumes, and event vs. ingestion time.
Set up alerting and fallback mechanisms.
Test for both technical and data quality errors (e.g., nulls, schema mismatches).
Data Transformation
Where raw data becomes usable.
Validate inputs and outputs with data tests.
Monitor metrics like schema correctness, null rates, and data distributions.
Optimise performance (query time, memory use) and watch cloud costs (FinOps awareness).
Data Serving
The final mile, where data meets the user.
Ensure uptime and latency SLAs for dashboards, APIs, and reports.
Monitor data quality at the point of delivery.
Use versioning for models and reports, and secure access via roles and audits.
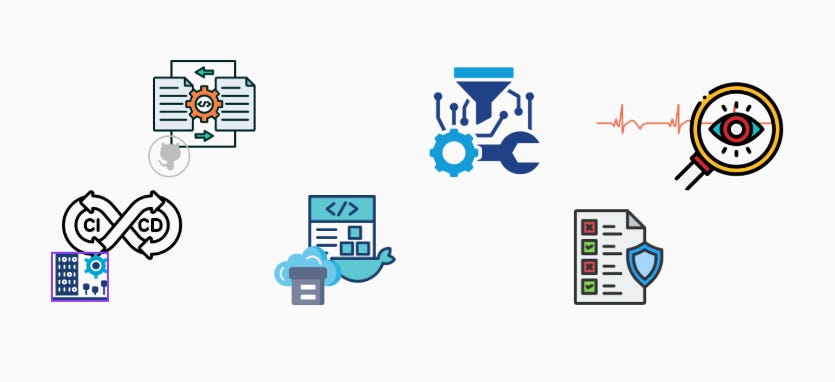
Key DevOps/DataOps Tools for Data Engineers
In the world of data engineering, there's no shortage of tools, but not all tools are created equal. Some are built for a specific purpose, while others span multiple parts of the data workflow.
For example, dbt started as a transformation tool, but now it also supports CI/CD for data models, data testing, and even some orchestration. Similarly, Dagster, while primarily an orchestration tool, also offers built-in observability, CI/CD integrations, and data asset tracking.
The boundaries are fading. Tools today are evolving to cover multiple stages of the DataOps lifecycle, including development, testing, deployment, monitoring, and beyond.
Below is a breakdown of essential tools grouped by their primary function, helping you build reliable, scalable, and maintainable data systems.
Version Control and Collaboration
GitHub, GitLab, Azure DevOps.
Code reviews, pre-commit hooks.
CI/CD and Infrastructure as Code
CI/CD: GitHub Actions, Jenkins, GitLab CI.
IaC: Terraform, CloudFormation, Azure Resource Manager.
If you want to learn more about Infrastructure as Code and Terraform, check out these detailed posts:

Containerisation and Orchestration
Containers: Docker
Orchestration: Kubernetes, ECS, Azure Container Instances
Dev tools: Docker Compose, Skaffold
If you are not familiar with Docker, we highly suggest checking the Docker Fundamentals for Data Engineers post here:

Workflow Orchestration
Orchestrators: Airflow, Prefect, Dagster, AWS Glue
Keen to learn more about orchestration? Check out our three orchestration posts here:


Quality Assurance
Data validation: Great Expectations, Pandera, Soda, Deequ
Code testing: pytest, unittest, dbt Unit tests
Data transformation testing: dbt test
Want to dive deeper into data quality? Explore our series on data quality here4.
Monitoring and Observability
Monte Carlo, Dynatrace, Datadog
Interested in learning more about data Observability? Explore our detailed post here:

Documentation and Governance
Data catalogues: DataHub, Alation, Atlas
API documentation: Swagger/OpenAPI
Team documentation: Notion
Data lineage: dbt docs
Example Interview Questions
When it comes to DevOps and DataOps in interviews, you don’t need to know everything, especially for junior roles. But having a solid understanding of what DataOps is, its principles, tools, and techniques can really help you stand out in data engineering interviews.
Q1: A data pipeline has been running successfully for months, but recently started producing incorrect results while still showing "success" status. How does this scenario highlight the importance of DataOps observability?
Answer:
This is a classic "silent failure" scenario that demonstrates why system-level monitoring isn't sufficient for data workflows:
Based on my understanding, the issue is as follows:
System monitoring (e.g., pipeline execution, server health) indicates everything is running smoothly.
However, data quality monitoring is not in place to detect underlying data issues.
As a result, incorrect or incomplete data may go unnoticed, potentially causing business stakeholders to lose trust in the data.
How I could potentially suggest addressing it:
Data Quality Monitoring:
Statistical tests (mean, median, distribution changes)
Business rule validation (e.g., revenue can't be negative)
Comparison with historical patterns.
Multi-Layer Alerting:
Technical alerts: Pipeline failures, performance issues
Data alerts: Quality anomalies, missing data
Business alerts: SLA violations, user impact
Comprehensive Testing:
Unit tests for transformation logic
Integration tests with sample data
Regression tests comparing outputs over time
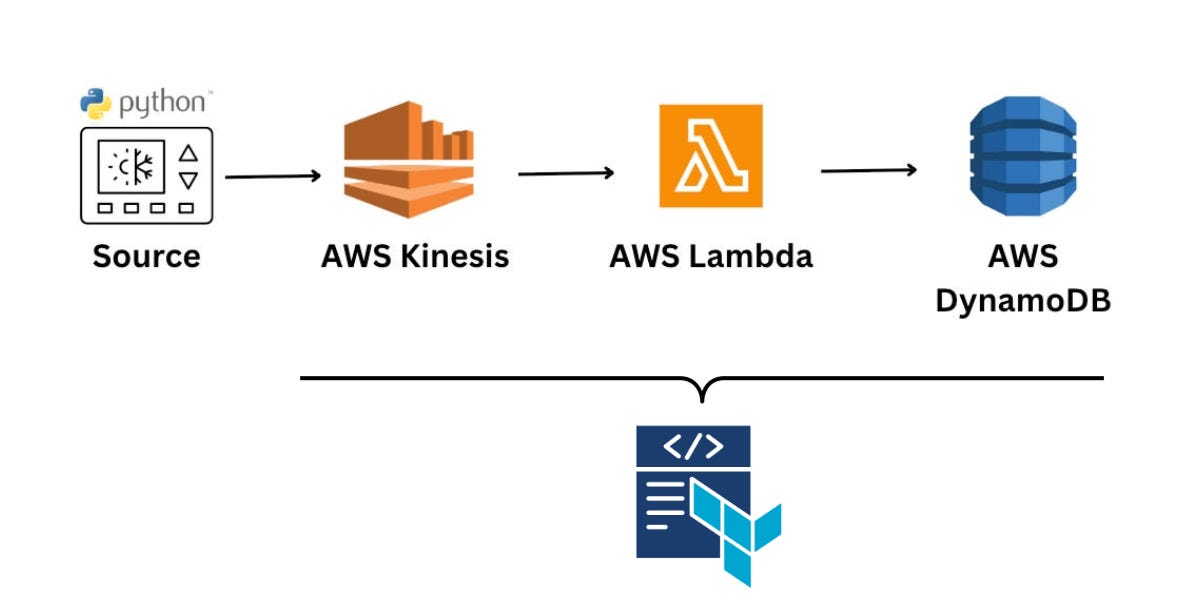
Q2: You are given a real-time data pipeline use case: simulate and process temperature data from IoT devices using AWS services. You can find the repo here5.
How would you use Infrastructure as Code (e.g., Terraform) to provision the necessary AWS resources, such as S3 buckets, IAM roles, CloudWatch alarms, and any other required services?
In your answer, explain how you would:
Structure your Terraform code to be modular and maintainable.
Apply security best practices (e.g., least privilege IAM, encryption).
Ensure proper tagging and naming conventions.
Support future scaling and observability needs.
Answer:
I’ll use Terraform to provision the AWS infrastructure for the data pipeline, which includes:
An S3 bucket for backup or raw data.
An IAM role for Lambda to access AWS services.
A Kinesis stream to ingest real-time IoT data.
A DynamoDB table to store device readings.
A Lambda function for processing the stream.
CloudWatch alarms to monitor health and performance.
Proper tagging, least-privilege IAM policies, and variable-driven configuration for flexibility.
All code is modular and reusable, with security and observability in mind.
I’ll start by creating the AWS resources using Terraform. These services will form the foundation of our real-time data pipeline.
You can find the full code here: [Github Repository]
providers.tf
This file tells Terraform which cloud provider to use and in which region.

We’re using the AWS provider here.
The region is not hardcoded; it’s defined as a variable so that we can easily change it from one place (in
variables.tf).
variables.tf
This file declares variables used across my Terraform configuration. It makes the code more flexible and reusable.
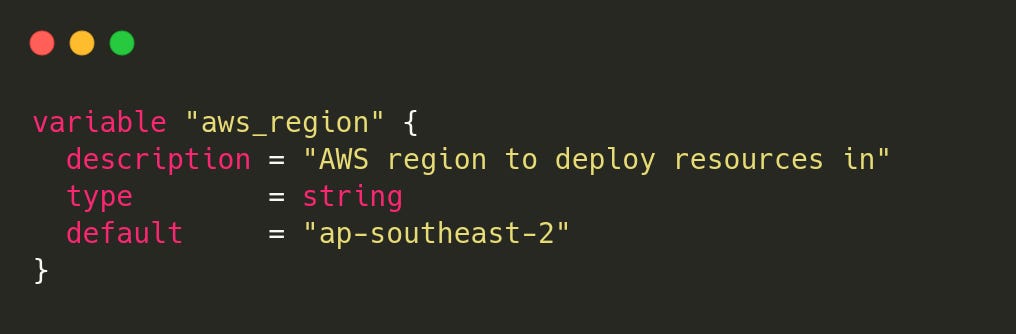
Here I define a single variable:
aws_regionIt’s used
providers.tfto set where our resources will be created.
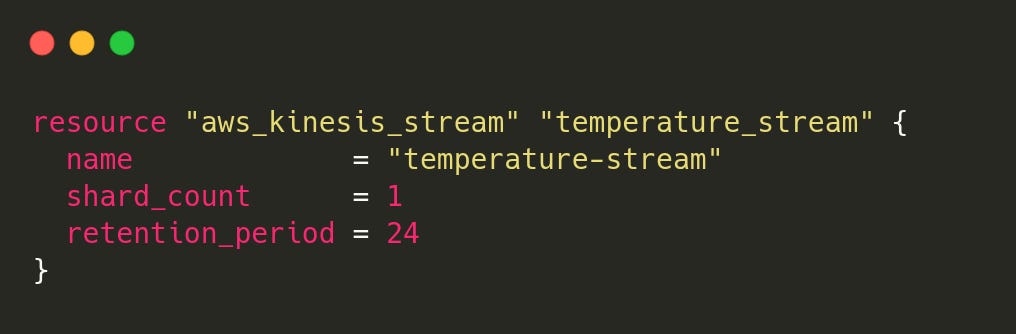
kinesis.tf (Amazon Kinesis Data Stream)
Kinesis is used in the project to ingest real-time temperature data from simulated IoT devices.
The stream is named
temperature-streamIt has one shard, which is enough for low-volume test data.
It stores the data temporarily so that consumers (like our Lambda function) can read and process it.
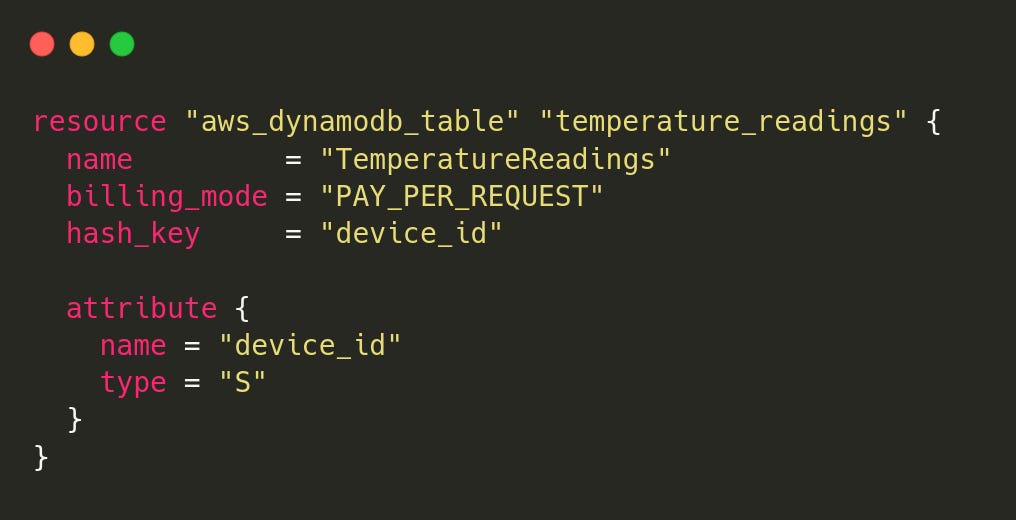
dynamodb.tf (Amazon DynamoDB Table)
DynamoDB, a fully managed NoSQL database, is used to store the latest temperature reading for each device.
Table name:
TemperatureReadingsPartition key:
device_idUses on-demand billing, so we don’t need to manage capacity

iam.tf (IAM Role for AWS Lambda)
To allow my Lambda function to access Kinesis, DynamoDB, and write logs to CloudWatch, I need an IAM role with the appropriate permissions.
This role:
Can be assumed by a Lambda function.
Grants read access to Kinesis.
Grants full access to DynamoDB.
Grants permission to write logs to CloudWatch.

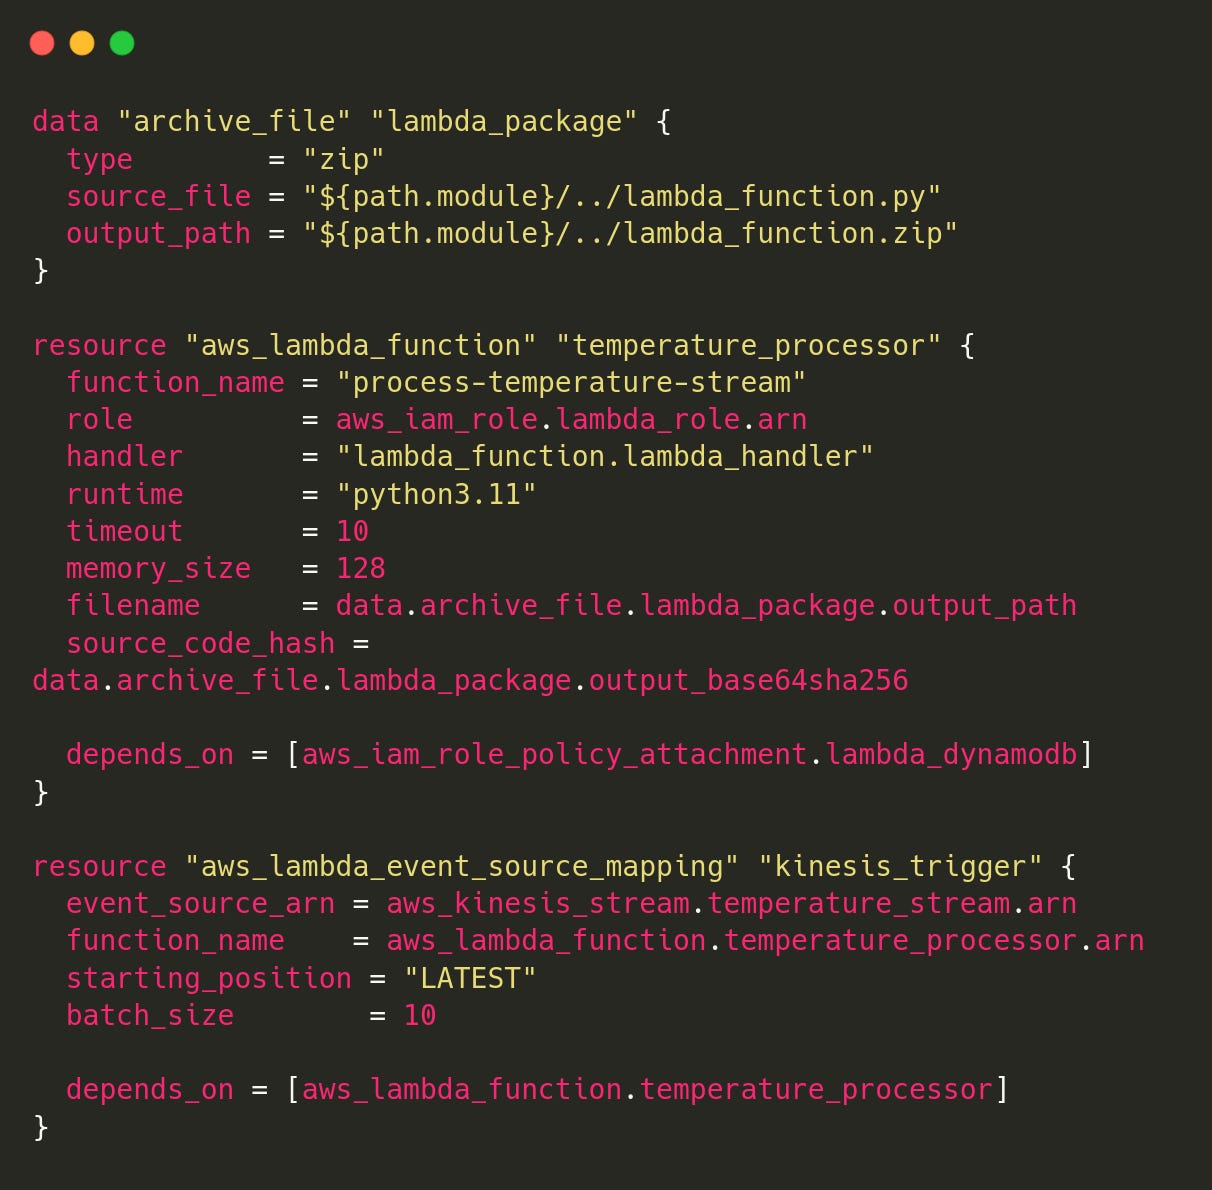
lambda.tf
After creating the Kinesis stream and DynamoDB table, I use AWS Lambda to process temperature readings in real time.
This Lambda function is written in Python and deployed via Terraform. It:
Listens to the
temperature-streamDecodes and parses each record
Write the latest temperature per device to the
TemperatureReadingsDynamoDB table
outputs.tf
This file lets Terraform print out important resource names or ARNs after the infrastructure is created.

After a successful terraform apply, you’ll see output like:

My AWS resources (Kinesis stream, DynamoDB table, and IAM role) are ready
Q3: Imagine you're working on a data pipeline project that uses dlt (data load tool) for ingestion and dbt for transformation. How would you design and set up a CI/CD pipeline using GitHub Actions (or your CI tool of choice) to ensure code quality and reliable deployment? What kinds of automated checks would you include, how would you structure the workflow, and how would you manage sensitive credentials such as database usernames and passwords?
Answer:
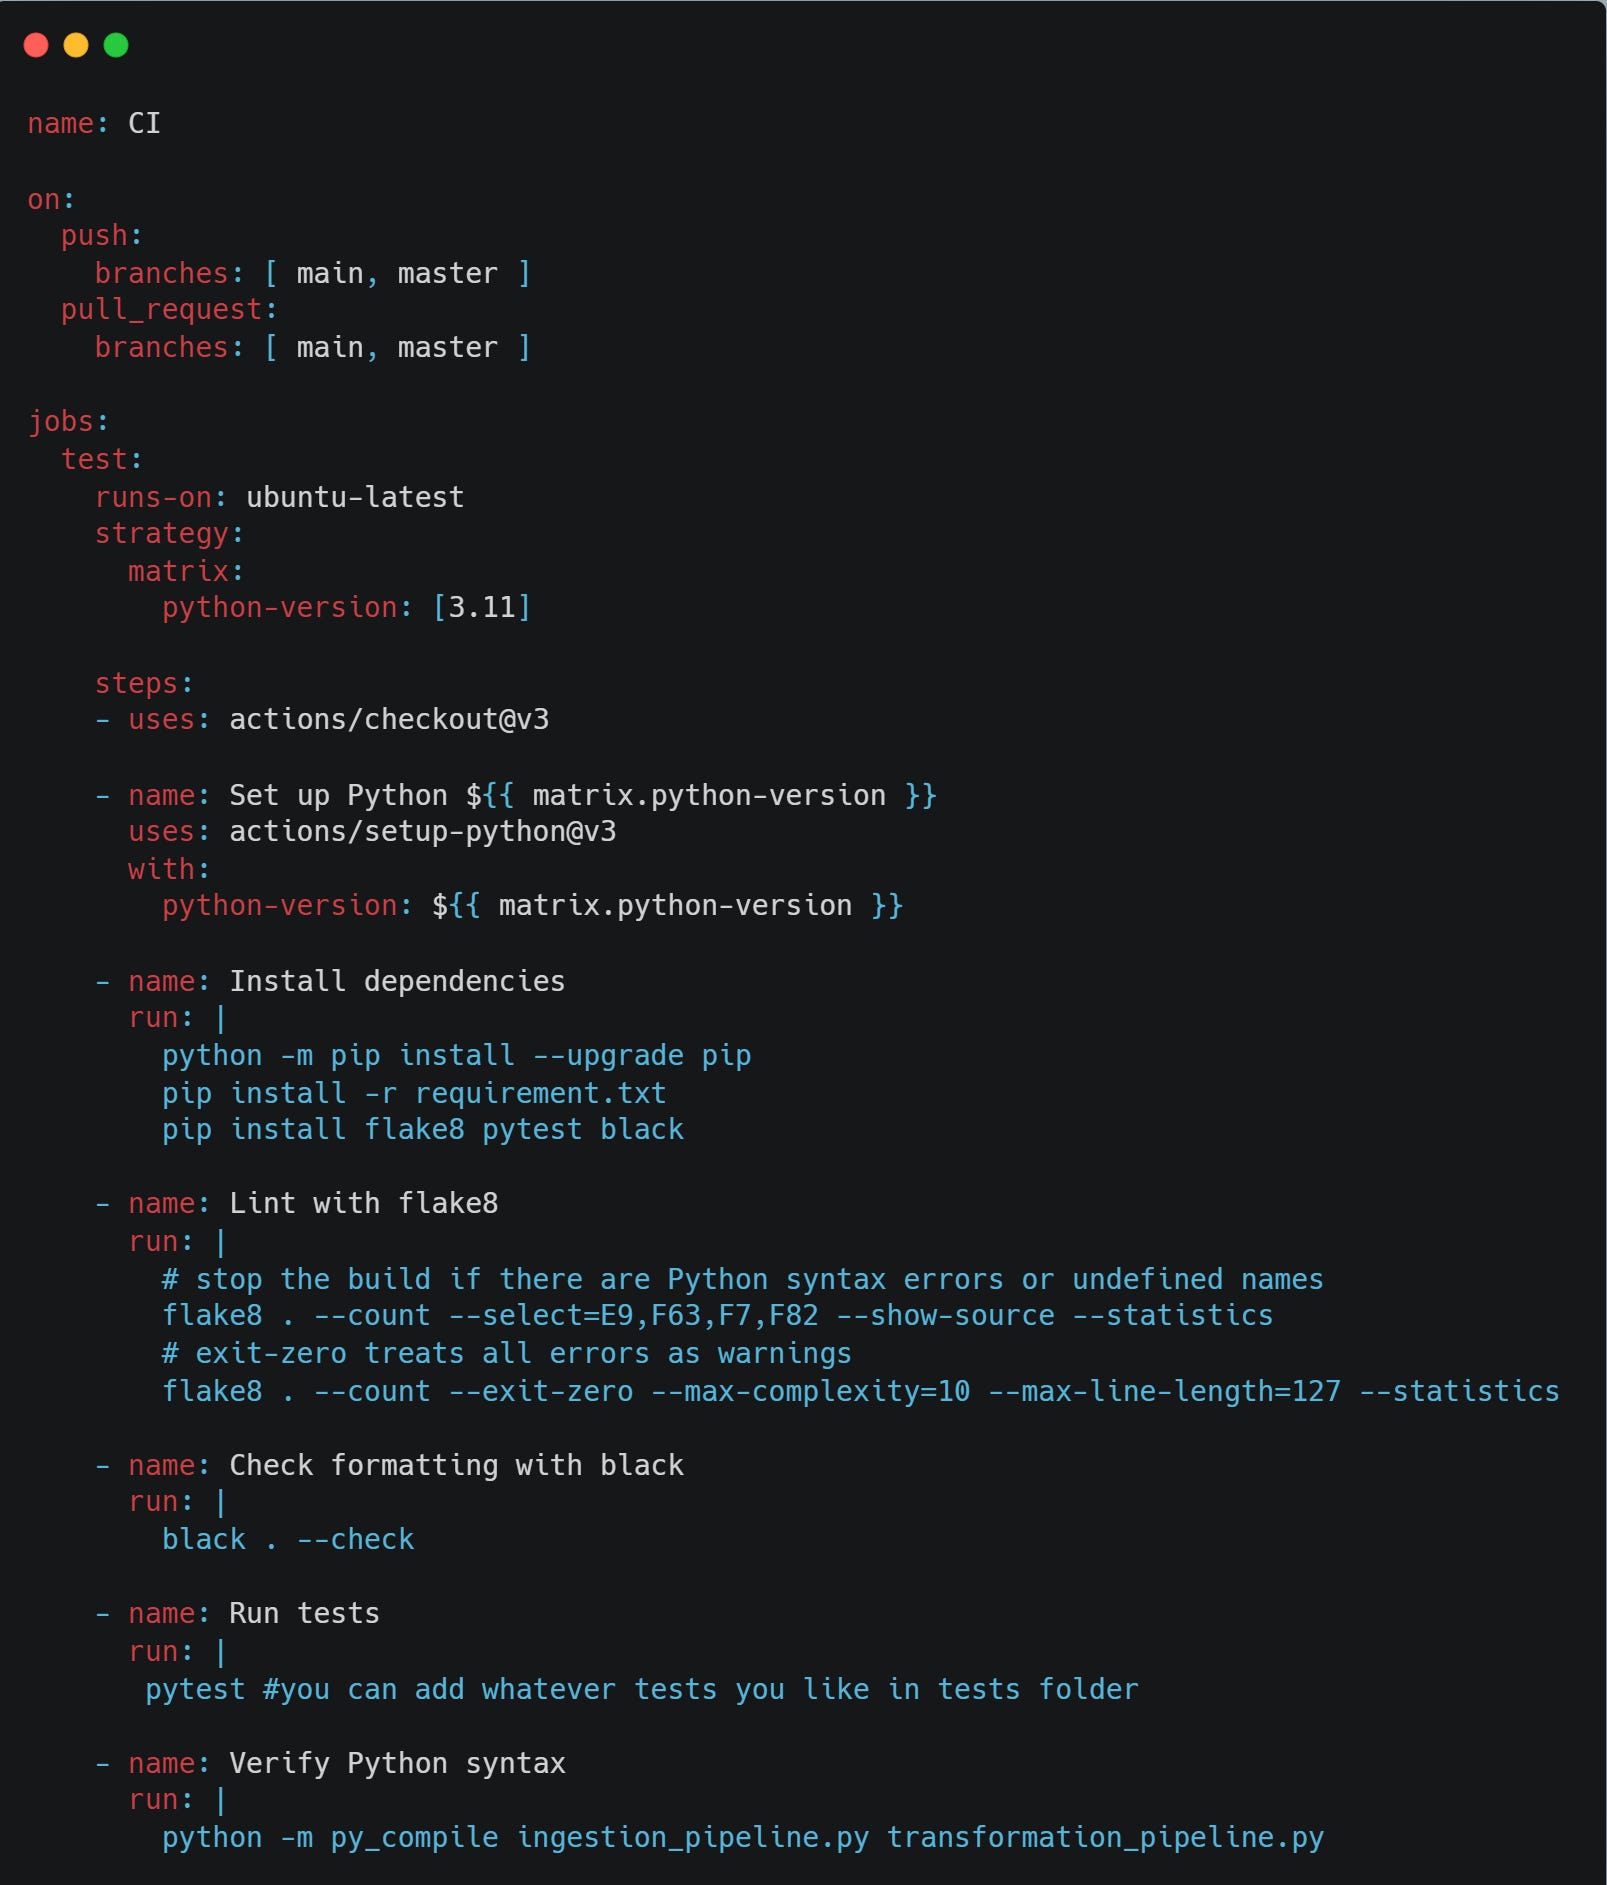
I designed this GitHub Actions CI workflow to enforce code quality checks every time code is pushed to the main or master branch, or when a pull request is made to those branches.
Trigger Conditions:
The workflow is triggered on two events:
A direct push to
mainormasterA pull request targeting
mainormaster
This ensures that any code entering the mainline is automatically verified.
Job Setup:
The workflow defines a single job called test that runs on the ubuntu-latest virtual environment. It uses a matrix strategy to define Python versions, in this case, only Python 3.11. This setup allows for easy expansion to multiple Python versions if needed.
Steps:
Check out the repository:
I useactions/checkout@v3to pull the latest code into the runner so the following steps can access it.Set up Python:
actions/setup-python@v3installs Python 3.11 in the environment, ensuring consistency with my local and production environments.Install dependencies:
I upgradepipand then install dependencies fromrequirement.txt. I also install flake87, pytest8, and black9, which are my main tools for linting, testing, and formatting checks.Lint with flake8:
This is a two-part linting step:The first command checks for critical issues like syntax errors or undefined names and will fail the build if any are found.
The second command runs a broader style check (e.g., line length, complexity), but doesn’t fail the build thanks to
--exit-zero. This is useful for reporting without being too strict during early development.
Check formatting with black:
This step ensures all Python code follows the Black formatting standard The--checkflag makes it a dry run — the build will fail if files need to be reformatted.(Commented out) Run tests:
There’s a placeholder for running tests withpytest, but it’s currently commented out. Enabling it would run unit or integration tests automatically.Verify Python syntax:
This final step usespy_compileto check for syntax errors in specific scripts (ingestion_pipeline.pyandtransformation_pipeline.py). It doesn’t run the code, just compiles it, which is a lightweight way to catch obvious mistakes.
Implementation:
At the root of my project, I created a .gitignore file, a .github/workflows/ directory, and added a ci.yml file to define the CI workflow.
mkdir -p .github/workflows
touch .github/workflows/ci.yml
Then copy this to the ci.yml file:
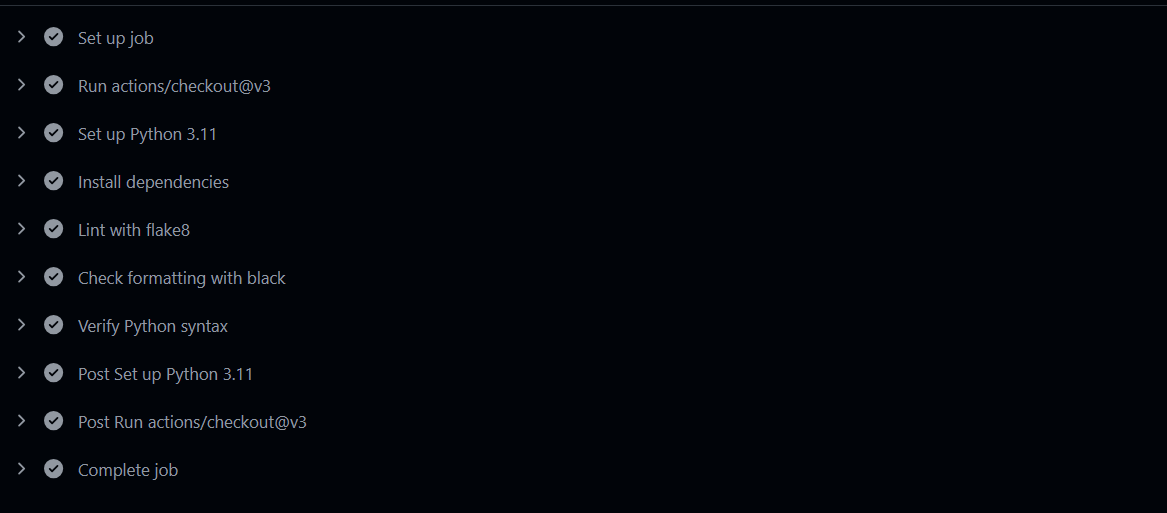
To verify that it's working correctly, I check the workflow status in GitHub.
Q4: You are given a dbt project that implements data quality checks using dbt_expectations10 and DuckDB11. Your task is to containerise this project using Docker12. The project structure is as follows:

Answer:
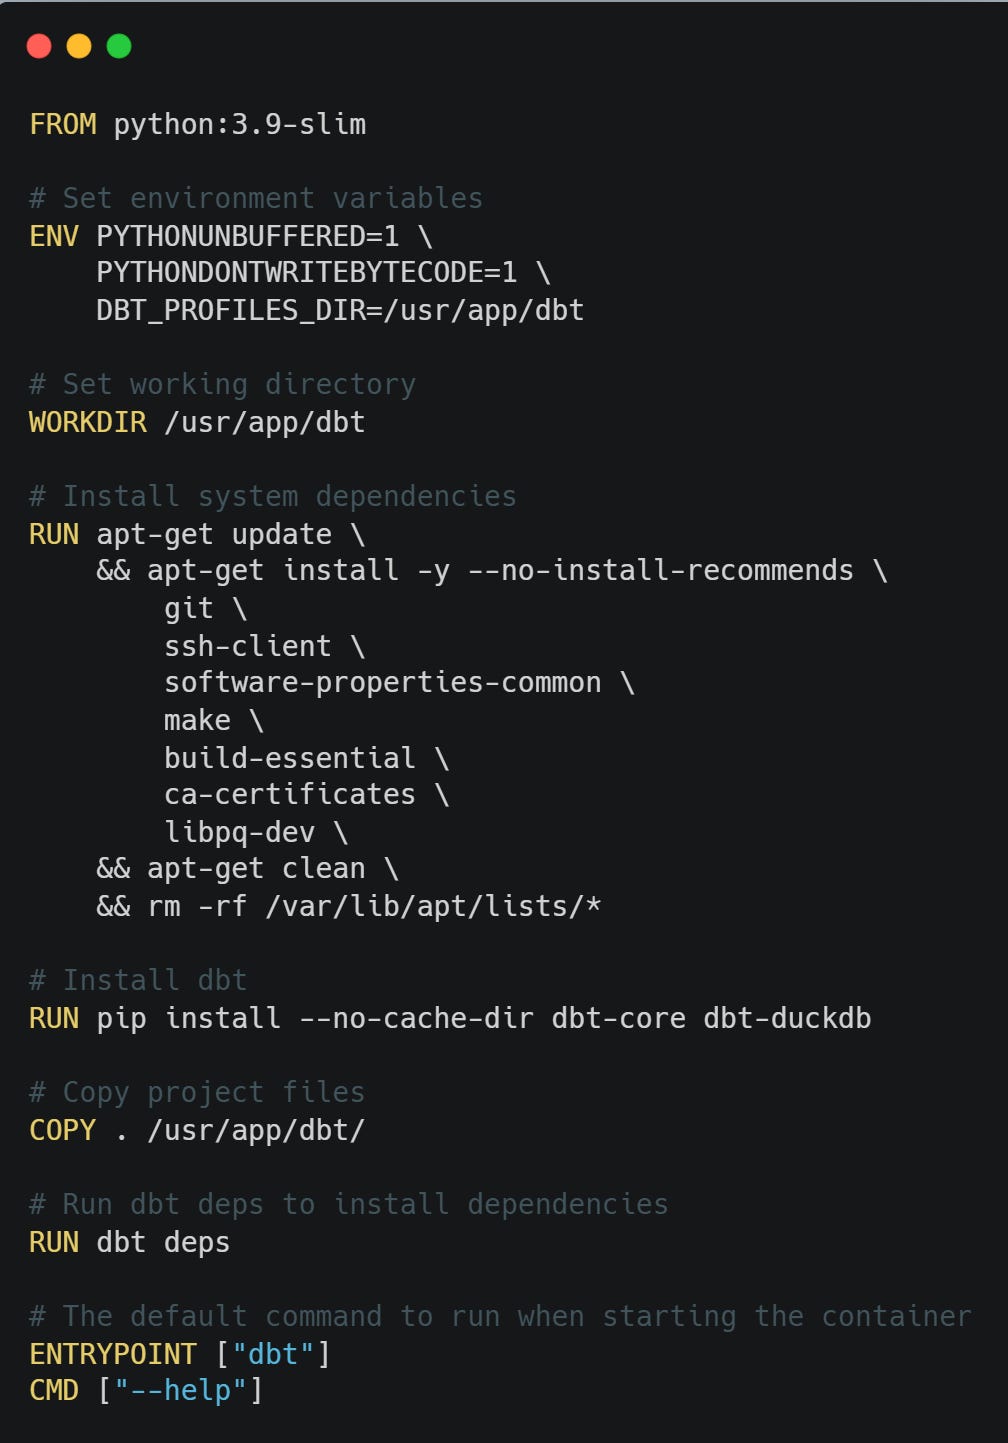
Create Dockerfile:
The Dockerfile defines the custom environment in which my dbt project will run. It ensures the same version of Python and dbt packages (including DuckDB and dbt-expectations) are used, making my setup reproducible, portable, and consistent across machines and CI/CD pipelines.
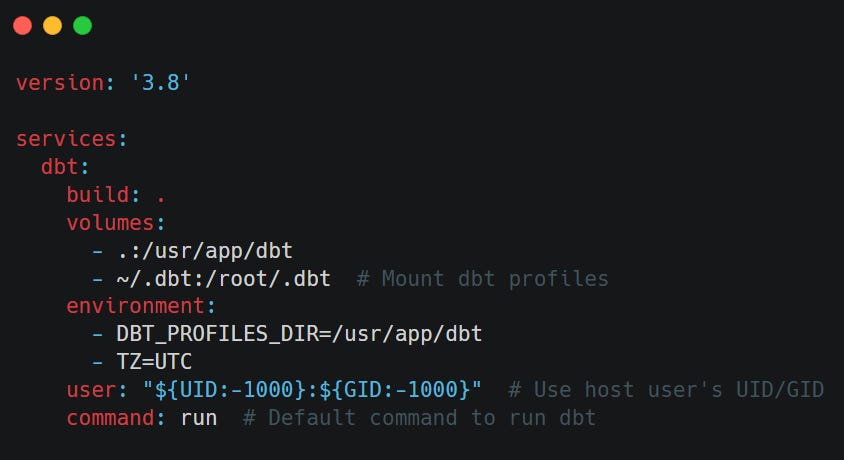
Create docker-compose.yml:
docker-compose.yml simplifies the management, configuration, and execution of my container. It lets me mount local files (my dbt project, profiles.yml, and data), define environment variables, and easily run or test the container with one command.
Testing the Setup:
Once my Dockerfile and docker-compose.yml are in place, it’s important to validate that my containerised dbt environment works as expected.
Here’s how I implement that, step by step:
a. Build the Docker image:
docker-compose build
This command reads my Dockerfile, installs Python, dbt-core, dbt-duckdb, dbt-expectations, and copies my dbt project files into the image. It ensures that my container has everything it needs to run dbt commands.
b. docker-compose run dbt run
This tells Docker Compose to:
Start the
dbtservice defined in yourdocker-compose.ymlExecute the
dbt runcommand inside that container
dbt runcompiles and runs my dbt models (i.e., transforms my raw data into structured models like tables or views in DuckDB)
c. docker-compose run dbt test
This tells Docker Compose to:
Start the
dbtcontainerExecute
dbt testinside it
dbt testruns the tests defined in your dbt project, including:Built-in tests (
unique,not_null,accepted_values)Custom or package-based tests (like those from
dbt_expectations)
Conclustion
DataOps represents a fundamental shift in how we think about data, from a byproduct of business operations to a first-class product that requires engineering discipline, quality assurance, and continuous improvement.
The organisations that embrace DataOps will build competitive advantages through:
Faster Innovation: Rapid deployment of new data products and insights
Higher Quality Decisions: Trustworthy data that stakeholders can rely on
Operational Excellence: Resilient data systems that recover quickly from issues
Cultural Transformation: Teams that collaborate effectively across technical and business boundaries
The question isn't whether to adopt DataOps, it's how quickly we can get started. Begin with small experiments, focus on high-impact improvements, and build momentum through early wins.
Our data is too valuable to leave to chance. Give it the operational excellence it deserves.
Not sure which tools to use as a data engineer? This post will help you navigate the options and choose the right ones for your workflow.

Curious about what a proactive mindset means for data engineers? Check out this post to learn why it matters and how to develop one.

We Value Your Feedback
If you have any feedback, suggestions, or additional topics you’d like us to cover, please share them with us. We’d love to hear from you!

Enjoy Pipeline to Insights? Share it with others!
Refer 3 friends and get a 1-month free subscription.
Refer 10 and get 3 months free.
Bring in 25 referrals and enjoy a 6-month complimentary subscription
Our way of saying thanks for helping grow the Pipeline to Insights community!
https://www.amazon.com.au/dp/1491926309?ref_=mr_referred_us_au_au
https://pipeline2insights.substack.com/t/interview-preperation
https://www.amazon.com.au/Fundamentals-Data-Engineering-Robust-Systems/dp/1098108302
https://pipeline2insights.substack.com/t/data-quality
https://github.com/pipelinetoinsights/aws-real-time-pipeline
https://github.com/pipelinetoinsights/elt-pipeline-with-dlt-and-dbt
https://flake8.pycqa.org/en/latest/
https://docs.pytest.org/en/stable/
https://pypi.org/project/black/
https://hub.getdbt.com/metaplane/dbt_expectations/latest/
https://duckdb.org/
https://www.docker.com/
https://github.com/pipelinetoinsights/data-quality-framework-with-dbt