Week 27/31: Data Visualisation for Data Engineers
What Data Engineers need to know about Data Visualisation and Storytelling skills

Anyone working with data or responsible for communicating insights using data needs to have at least a foundational understanding of data visualisation and storytelling. These skills aren't exclusive to data analysts, business analysts, or visualisation specialists; they’re relevant across all data roles, including data engineers.
While data engineers are primarily focused on building reliable, scalable and high-quality data systems, one of the key end goals is often to support effective data visualisations. Moreover, throughout their careers, data engineers will find themselves using visualisation and storytelling skills in various contexts. Whether it’s collaborating more effectively with analysts, explaining technical decisions to both technical and non-technical stakeholders, or standing out in job interviews, having a solid foundation in visual communication can be a major asset.
In job interviews, these skills may not always be tested directly, but sometimes we’ll be asked to build an end-to-end data pipeline that includes a dashboard or visualisation component. Even in day-to-day work, being able to interpret, critique, or present visualisations can significantly improve how our work is understood and valued.
In this post, I’ll cover key fundamentals that every data engineer should know, including:
What is Data Visualisation?
Why is Data Visualisation Important?
Why do Data Engineers need visualisation skills?
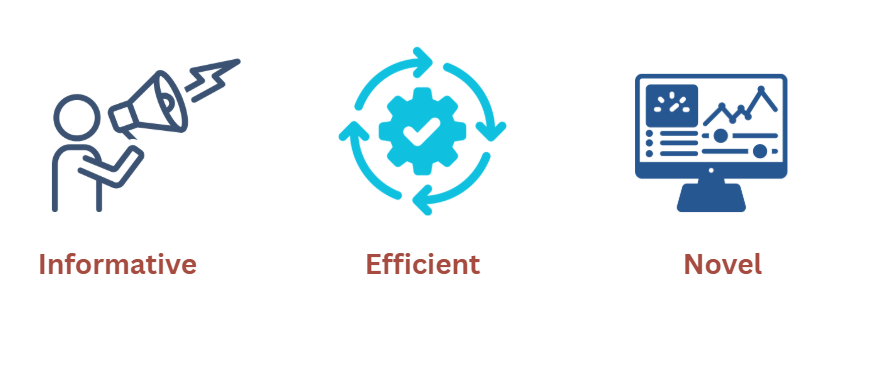
What makes a good visualisation?
How to choose the right type of visualisation.
5 Practical Tips for cleaner, more impactful visuals.
Don’t miss the P2I Data Engineering Interview Preparation series. Check out the full series [here1] and subscribe to stay updated with new posts and tips.
Here is the full plan:

What is Data Visualisation?

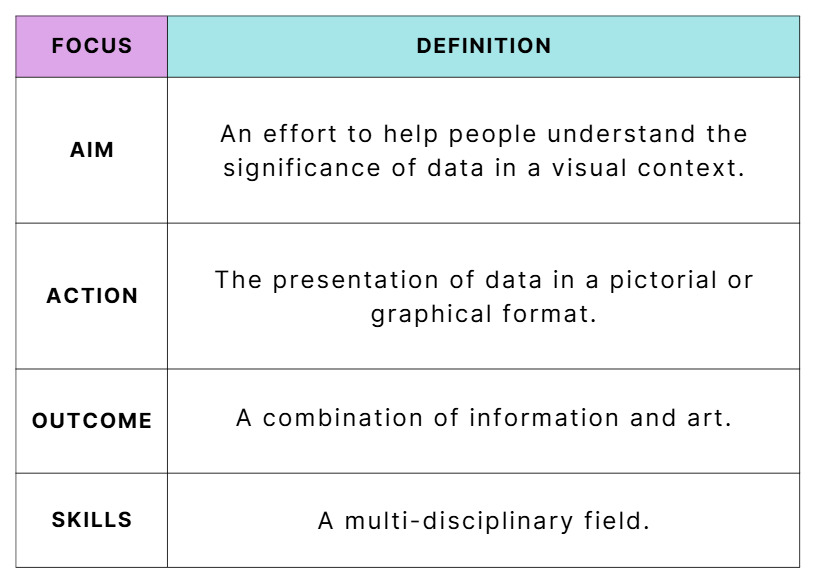
Before diving into how to use data visualisation effectively, it's important to understand what it actually means. The term "data visualisation" can take on different meanings depending on our perspective, whether we're an engineer, analyst, designer, or executive. At its core:
it’s about transforming data into a visual format to help people make sense of it, take action, or uncover new insights.
Below are a few widely accepted definitions that highlight the diverse goals and skills involved in data visualisation, from making data understandable to blending information with design.
To explore data visualisation further, I highly suggest these two insightful books:
Data Points: Visualisation That Means Something2 by Nathan Yau.
Storytelling with Data: A Data Visualisation Guide for Business Professionals3 by Cole Nussbaumer Knaflic.
Why is Data Visualisation important?

There are several important reasons to use data visualisation; it’s not just about making things look nice. It’s a critical skill to:
Understand what’s going on in the data
Visualisations help us explore patterns, trends, and anomalies. This allows us to avoid false assumptions and discover new insights.Communicate information clearly
A well-crafted chart can often say more than a page of text. As the saying goes, “a picture is worth a thousand words.”Capture attention
In fast-paced work environments, visuals help cut through the noise. A good visual can grab someone's attention and guide them to what's important.Strengthen our career
Data visualisation is a valuable skill across many data roles. Whether you're applying for a job or presenting your work internally, strong visualisation skills make your contributions stand out.
Why do Data Engineers need visualisation skills?
As a data engineer, our job doesn’t end when the pipeline finishes. It truly delivers value when someone takes action based on a trusted, meaningful visualisation. Visualisations aren't just byproducts; they’re critical interfaces between the data infrastructure and real-world decision-making. Whether you’re building for executives, analysts, or applications, success depends on knowing our users, embedding trust, and aligning our dashboards with purpose.
Common scenarios where Data Engineers use visualisation:

Here are several practical cases where data engineers often engage with data visualisation:
Building Data Products
Sometimes the product itself is a visualisation, such as a dashboard for monitoring sales, energy usage, or customer metrics. In other cases, visualisations are embedded into emails, reports, or applications that communicate key data points to stakeholders.Exploratory Data Analysis (EDA)
During the early stages of development, such as after gathering requirements or investigating a potential data source, data engineers can use visualisations (e.g., histograms, bar charts, scatter plots) to explore the data, summarise statistics, and identify anomalies. These visuals help communicate findings with stakeholders or act as prototypes for future dashboards.Data Quality Communication
When data quality issues occur, visualisations can help pinpoint where and when they happen, making them easier to explain and debug. Trend charts, null-value heatmaps, or comparison visuals are often the clearest way to communicate what’s gone wrong.
Want to learn more about data quality? Check out our data quality series here4.
Monitoring and Observability
Visual tools like dashboards are critical in DataOps workflows, from monitoring pipeline performance and detecting anomalies to tracking failed jobs or delays. Visualisation is central to observability, helping engineers maintain trust in their data systems.
If you're keen to learn about DevOps and DataOps practices for data engineers, check out this post:

Wearing multiple hats
In smaller companies or startups, data engineers often take on responsibilities that blur the line with data analysts. This includes creating reports, dashboards, and presentations for business users.Collaboration across roles
Even in larger teams, visualisation helps data engineers collaborate more effectively with analysts and data scientists. Speaking the same "visual language" helps ensure shared understanding and alignment across the data team.
What makes a good visualisation?